Rebuilding an underperforming enterprise app into a platform standard.
300% increase in downloads. 20% fewer support calls. The app redesign turned a cost center into a sales opportunity. And the patterns spread throughout the org.
Project Details
- COMPANY
- Splunk
- ROLE
- Sole UX Designer
- LENGTH
- 6 months
- TEAM
- 1 UX + 6 dev + 1 PM + 1 QA
- YEAR
- 2015
About Splunk
Splunk leverages a powerful search and analytics platform to turn machine data into real-time visibility. It surfaces hidden patterns and anomalies across infrastructure, applications, and security systems.
The Splunk App for Microsoft Exchange was built to give IT admins monitoring visibility into their Exchange environment. But it wasn’t working.
The app strategy was failing.
The problem
The Exchange app was not gaining adoption with IT Admins so datasets were not being added to their Splunk instances.
The cost
Splunk’s business model is straightforward: people build on the platform, and when they bring in data, Splunk charges for it.
The stakes
If no data is added, licensing doesn’t increase, and the platform doesn’t make money.
The original user experience required navigating between dozens of individual tools.
I want big green lights.
Users wanted visibility
IT Admins didn’t need better or more tools. In fact, that would make things worse: they would have even more pages to manage and navigate.
Changing the mental model
The IT Admin Toolbox was for putting out fires.
Service monitoring to see the smoke before the fire.
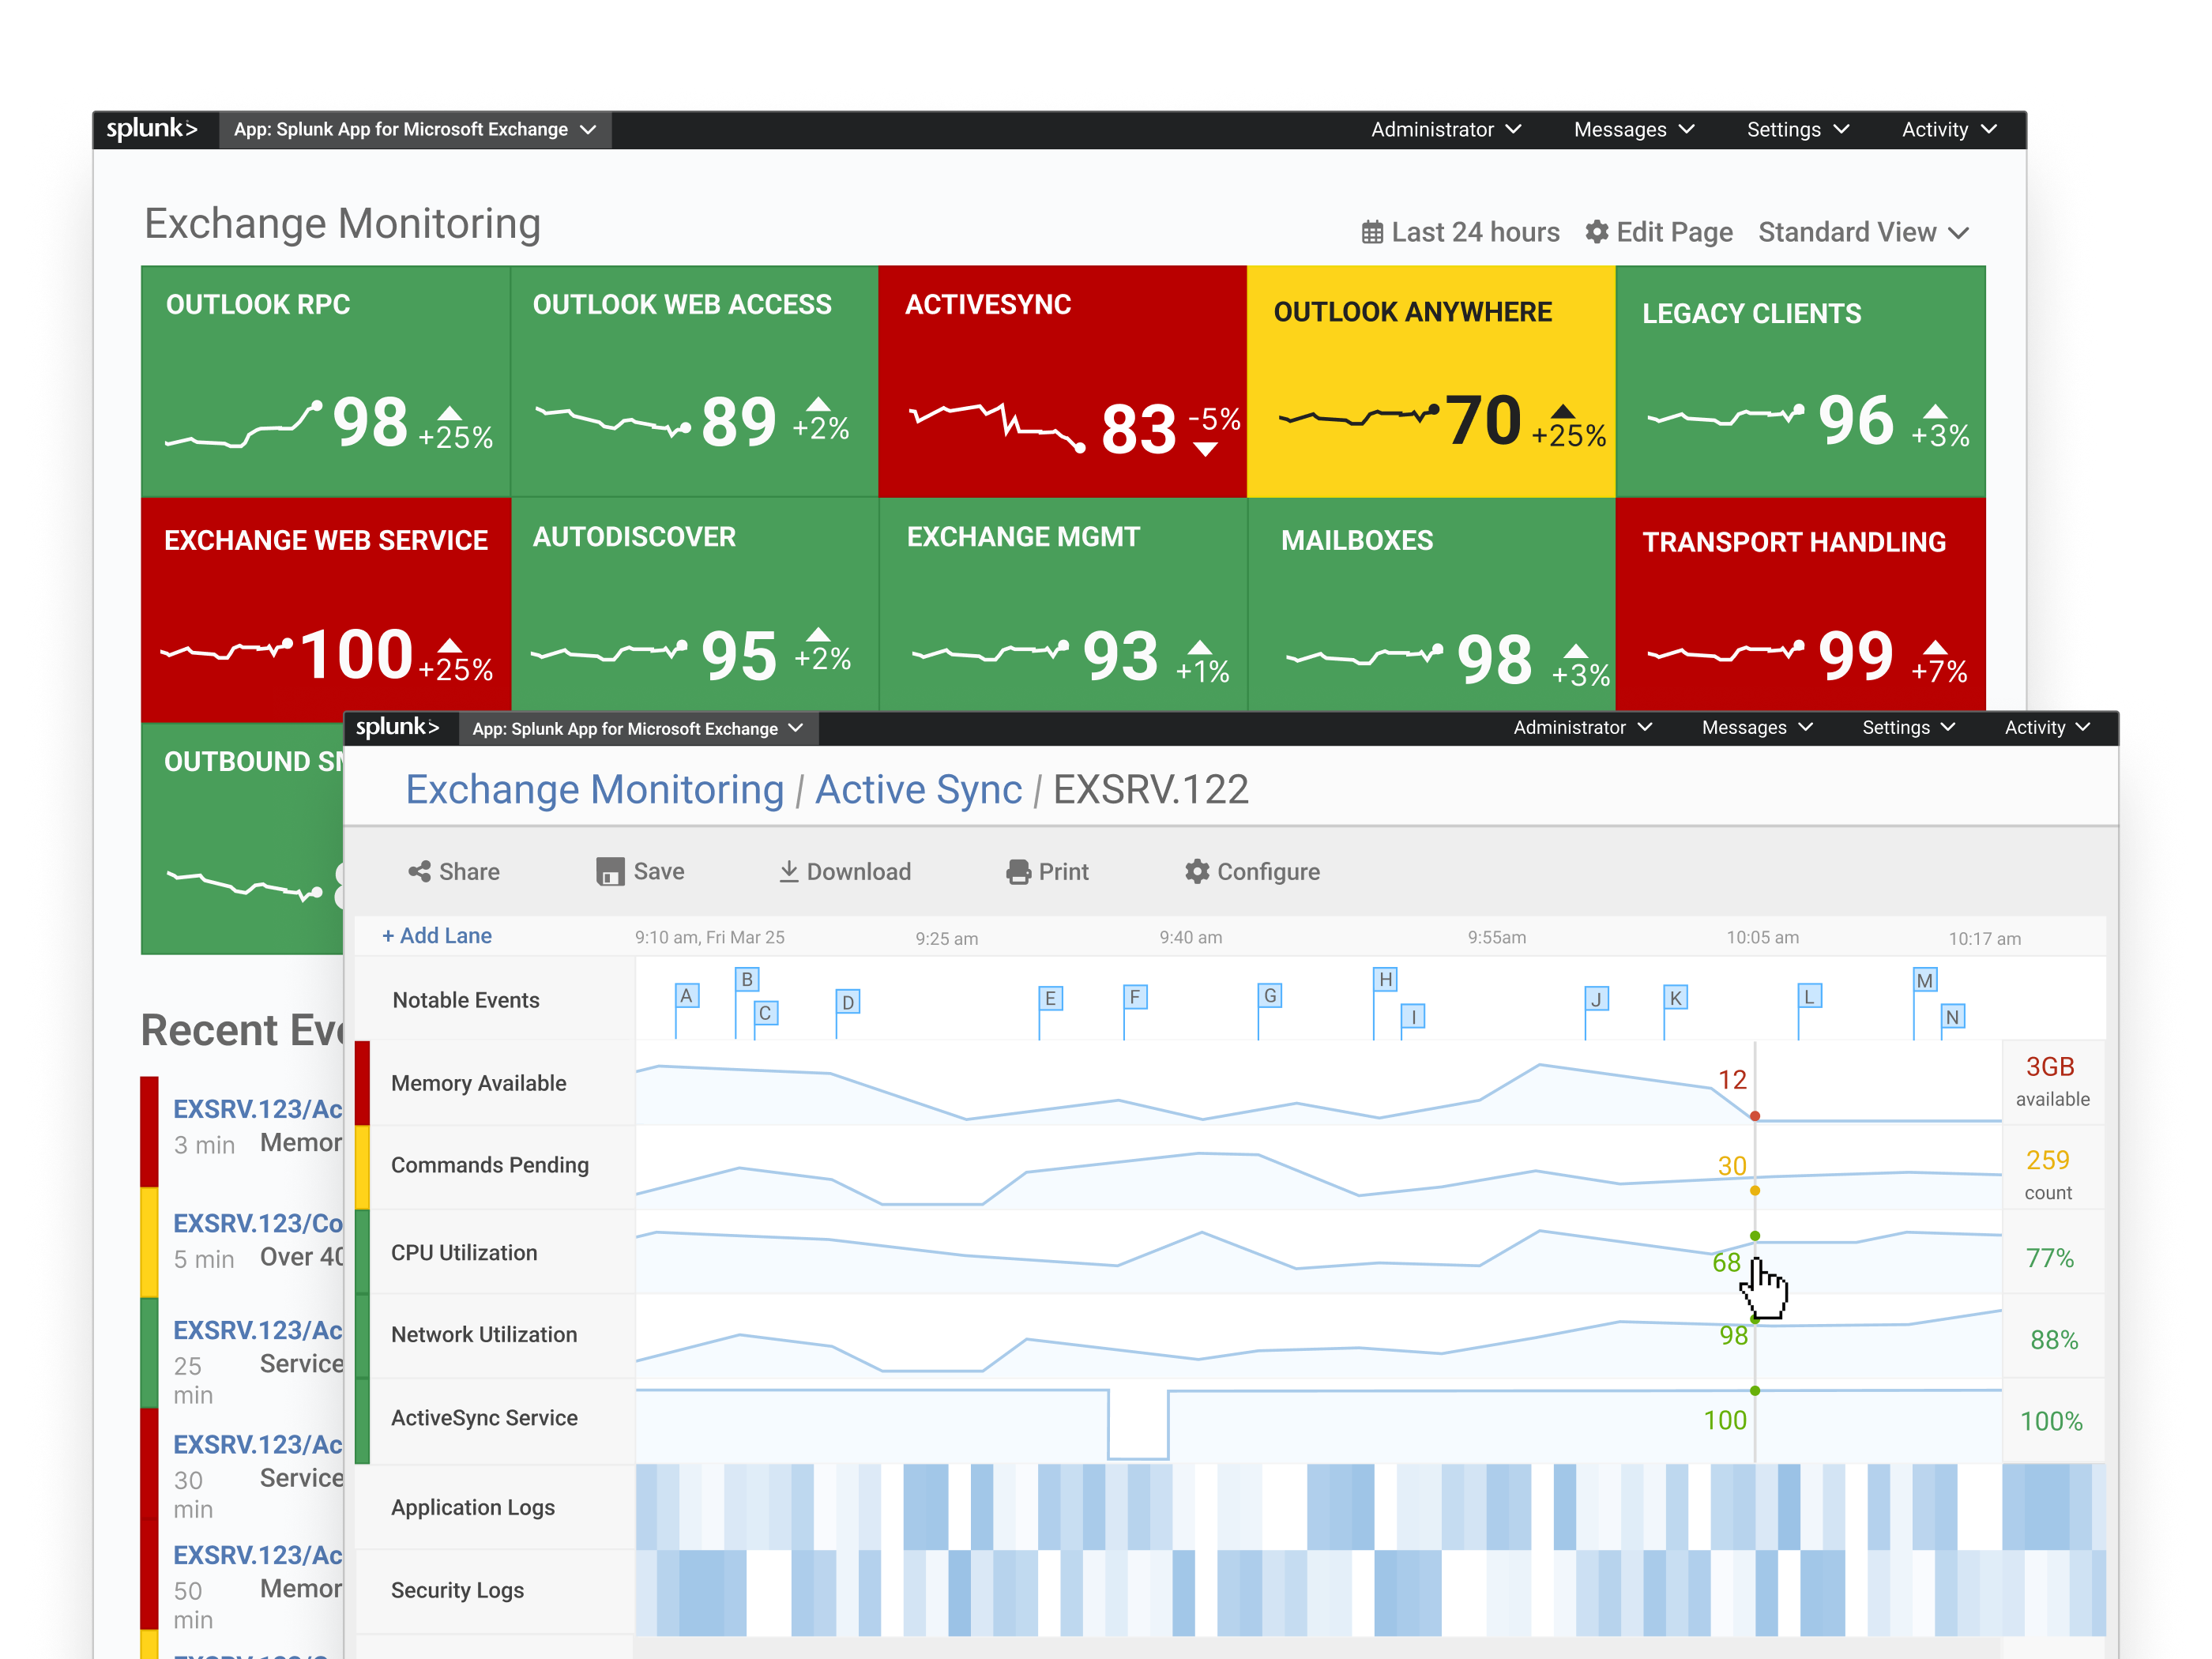
Instead of scattered tools, I designed a single monitoring page with traffic-light KPI tiles that could zoom to fit a Network Operations Center TV. Red, yellow, green at a glance, with drill-down when something needed attention. The page stopped being a troubleshooting tool and became a confidence indicator.
A traffic-light dashboard needs thresholds, and admins don’t have best-practice ranges for every Exchange KPI memorized. I built a configuration tool that pulled in historical KPI data so admins could set thresholds against their own baseline — not someone else’s best practices.
When something went yellow or red, admins needed to drill into the details. I designed KPI swim lanes to contextualize logs — letting admins scrub across time and compare metrics side by side. The drill-down turned the dashboard from a signal into a diagnostic tool.
Initial feedback showed that Admins would download the app, hit a wall, and call support. I designed a setup wizard that detected prerequisites automatically and only let admins proceed once their environment was ready.
We went onsite to test early versions of the monitoring dashboard and found that when the visualization didn’t fill the big TV up on the wall in the network operations center (NOC), it was less impactful. I added controls to zoom appropriately for the screen, so IT admins could see the full-size visual from across the room.
Results.
Downloads Increased
300% increase in app downloads — IT admins were using the app and getting value.
Patterns Impacted the Org
UI patterns adopted by Splunk’s flagship IT app. Wizard and single value tile added to core Splunk.
Support Calls Reduced
20% fewer support calls, despite increased usage, traced to the setup wizard.
Designs Endured
The patterns have persisted and still show up on the company home page and product pages.